Example 1: Run analyzePRF on an example dataset
Contents
Download dataset (if necessary) and add analyzePRF to the MATLAB path
setup;
Load in the data
load('exampledataset.mat');
whos
  Name          Size               Bytes  Class    Attributes

  data          1x4                24448  cell
  stimulus      1x4             48000448  cell
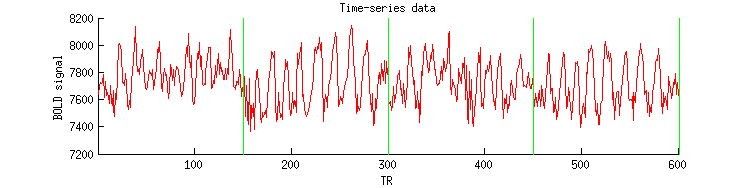
Inspect the data
data
data =

    [10x150 single]    [10x150 single]    [10x150 single]    [10x150 single]
temp = cellfun(@(x) x(2,:),data,'UniformOutput',0);
figure; hold on;
set(gcf,'Units','points','Position',[100 100 600 150]);
plot(cat(2,temp{:}),'r-');
straightline(150*(1:4)+.5,'v','g-');
xlabel('TR');
ylabel('BOLD signal');
ax = axis;
axis([.5 600+.5 ax(3:4)]);
title('Time-series data');
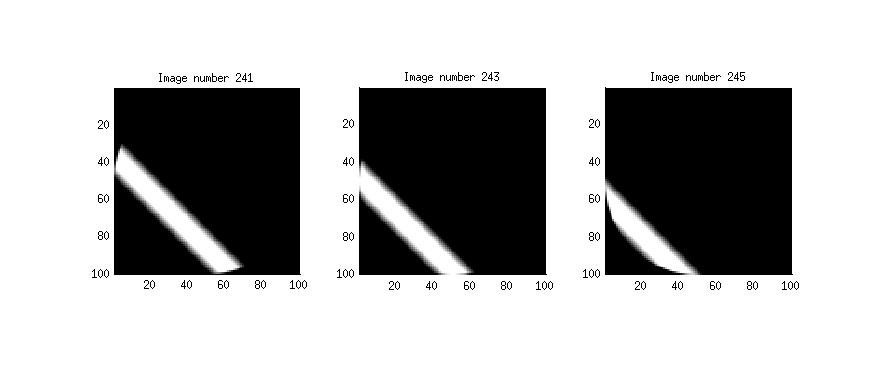
Inspect the stimuli
stimulus
stimulus =

  Columns 1 through 3

    [100x100x300 single]    [100x100x300 single]    [100x100x300 single]

  Column 4

    [100x100x300 single]
figure;
set(gcf,'Units','points','Position',[100 100 700 300]);
for p=1:3
subplot(1,3,p); hold on;
num = 239+2*p;
imagesc(stimulus{1}(:,:,num),[0 1]);
axis image tight;
set(gca,'YDir','reverse');
colormap(gray);
title(sprintf('Image number %d',num));
end
Analyze the data
if matlabpool('size')==0
matlabpool open;
end
data = tseriesinterp(data,2,1,2);
results = analyzePRF(stimulus,data,1,struct('seedmode',[0 1],'display','off'));
Warning: Found 2 pre-existing communicating job(s) created by matlabpool that
are running. You can use 'matlabpool close force local' to remove all jobs
created by matlabpool.
Starting matlabpool using the 'local' profile ... connected to 12 workers.
*** analyzePRF: started at 16-Jun-2014 23:52:06. ***
using the following maximum polynomial degrees: [3 3 3 3]
*** fitnonlinearmodel: started at 16-Jun-2014 23:52:07. ***
*** fitnonlinearmodel: loading data. ***
*** fitnonlinearmodel: outputdir = , chunksize = 10, chunknum = 1
*** fitnonlinearmodel: processing voxel 1 (1 of 10). ***
  starting resampling case 1 of 1.
    trying seed 1 of 2.
      for model 1 of 2, the seed is [50.500 50.500 17.678 10.000 0.500 ].
*** fitnonlinearmodel: processing voxel 2 (2 of 10). ***
  starting resampling case 1 of 1.
    trying seed 1 of 2.
      for model 1 of 2, the seed is [50.500 50.500 17.678 10.000 0.500 ].
*** fitnonlinearmodel: processing voxel 3 (3 of 10). ***
  starting resampling case 1 of 1.
    trying seed 1 of 2.
      for model 1 of 2, the seed is [50.500 50.500 17.678 10.000 0.500 ].
*** fitnonlinearmodel: processing voxel 4 (4 of 10). ***
  starting resampling case 1 of 1.
    trying seed 1 of 2.
      for model 1 of 2, the seed is [50.500 50.500 17.678 10.000 0.500 ].
*** fitnonlinearmodel: processing voxel 5 (5 of 10). ***
  starting resampling case 1 of 1.
    trying seed 1 of 2.
      for model 1 of 2, the seed is [50.500 50.500 17.678 10.000 0.500 ].
*** fitnonlinearmodel: processing voxel 6 (6 of 10). ***
  starting resampling case 1 of 1.
    trying seed 1 of 2.
      for model 1 of 2, the seed is [50.500 50.500 17.678 10.000 0.500 ].
*** fitnonlinearmodel: processing voxel 7 (7 of 10). ***
  starting resampling case 1 of 1.
    trying seed 1 of 2.
      for model 1 of 2, the seed is [50.500 50.500 17.678 10.000 0.500 ].
*** fitnonlinearmodel: processing voxel 8 (8 of 10). ***
  starting resampling case 1 of 1.
    trying seed 1 of 2.
      for model 1 of 2, the seed is [50.500 50.500 17.678 10.000 0.500 ].
*** fitnonlinearmodel: processing voxel 9 (9 of 10). ***
  starting resampling case 1 of 1.
      the estimated parameters are [52.529 74.355 5.978 76.265 0.500 ].
      for model 2 of 2, the seed is [52.529 74.355 5.978 76.265 0.500 ].
      the estimated parameters are [19.275 81.401 4.753 60.739 0.500 ].
      for model 2 of 2, the seed is [19.275 81.401 4.753 60.739 0.500 ].
      the estimated parameters are [82.826 67.319 9.203 13.900 0.500 ].
      for model 2 of 2, the seed is [82.826 67.319 9.203 13.900 0.500 ].
      the estimated parameters are [86.615 68.787 9.404 15.638 0.300 ].
    trying seed 2 of 2.
      for model 1 of 2, the seed is [50.500 50.500 1.768 10.000 0.500 ].
      the estimated parameters are [46.885 63.135 13.837 14.526 0.500 ].
      for model 2 of 2, the seed is [46.885 63.135 13.837 14.526 0.500 ].
      the estimated parameters are [50.493 57.199 12.850 12.397 0.500 ].
      for model 2 of 2, the seed is [50.493 57.199 12.850 12.397 0.500 ].
    trying seed 1 of 2.
      for model 1 of 2, the seed is [50.500 50.500 17.678 10.000 0.500 ].
      the estimated parameters are [43.631 48.537 12.724 10.902 0.500 ].
      for model 2 of 2, the seed is [43.631 48.537 12.724 10.902 0.500 ].
*** fitnonlinearmodel: processing voxel 10 (10 of 10). ***
  starting resampling case 1 of 1.
    trying seed 1 of 2.
      for model 1 of 2, the seed is [50.500 50.500 17.678 10.000 0.500 ].
      the estimated parameters are [52.922 75.000 5.726 80.878 0.428 ].
    trying seed 2 of 2.
      for model 1 of 2, the seed is [50.500 50.500 1.768 10.000 0.500 ].
      the estimated parameters are [74.300 54.937 1.736 8.361 0.500 ].
      for model 2 of 2, the seed is [74.300 54.937 1.736 8.361 0.500 ].
      the estimated parameters are [74.300 54.937 1.736 8.361 0.500 ].
    seed 1 was best. final estimated parameters are [86.615 68.787 9.404 15.638 0.300 ].
    trainperformance is 22.56. testperformance is NaN.
  aggregatedtestperformance is NaN.
*** fitnonlinearmodel: voxel 3 (3 of 10) took 3.6 seconds. ***
      the estimated parameters are [55.028 66.750 6.749 54.102 0.500 ].
      for model 2 of 2, the seed is [55.028 66.750 6.749 54.102 0.500 ].
      the estimated parameters are [55.011 66.802 6.710 53.973 0.495 ].
    trying seed 2 of 2.
      for model 1 of 2, the seed is [50.500 50.500 1.768 10.000 0.500 ].
      the estimated parameters are [43.631 48.537 12.724 10.902 0.500 ].
    trying seed 2 of 2.
      for model 1 of 2, the seed is [50.500 50.500 1.768 10.000 0.500 ].
      the estimated parameters are [49.809 53.286 15.984 9.320 0.500 ].
      for model 2 of 2, the seed is [49.809 53.286 15.984 9.320 0.500 ].
      the estimated parameters are [19.481 83.083 4.359 69.333 0.381 ].
    trying seed 2 of 2.
      for model 1 of 2, the seed is [50.500 50.500 1.768 10.000 0.500 ].
      the estimated parameters are [50.499 58.391 11.268 15.107 0.500 ].
      for model 2 of 2, the seed is [50.499 58.391 11.268 15.107 0.500 ].
      the estimated parameters are [50.499 58.391 11.268 15.107 0.500 ].
    trying seed 2 of 2.
      for model 1 of 2, the seed is [50.500 50.500 1.768 10.000 0.500 ].
      the estimated parameters are [58.142 79.149 8.758 17.497 0.038 ].
    trying seed 2 of 2.
      for model 1 of 2, the seed is [50.500 50.500 1.768 10.000 0.500 ].
      the estimated parameters are [41.404 68.931 13.044 27.904 0.500 ].
      for model 2 of 2, the seed is [41.404 68.931 13.044 27.904 0.500 ].
      the estimated parameters are [49.295 50.824 0.491 28.634 0.500 ].
      for model 2 of 2, the seed is [49.295 50.824 0.491 28.634 0.500 ].
      the estimated parameters are [47.943 53.976 16.377 9.012 0.404 ].
    trying seed 2 of 2.
      for model 1 of 2, the seed is [50.500 50.500 1.768 10.000 0.500 ].
      the estimated parameters are [49.374 64.243 12.199 16.348 0.163 ].
    trying seed 2 of 2.
      for model 1 of 2, the seed is [50.500 50.500 1.768 10.000 0.500 ].
      the estimated parameters are [52.806 53.032 1.166 22.226 0.500 ].
      for model 2 of 2, the seed is [52.806 53.032 1.166 22.226 0.500 ].
      the estimated parameters are [49.307 50.715 0.491 33.603 0.388 ].
    seed 2 was best. final estimated parameters are [49.307 50.715 0.491 33.603 0.388 ].
    trainperformance is 22.44. testperformance is NaN.
  aggregatedtestperformance is NaN.
*** fitnonlinearmodel: voxel 9 (9 of 10) took 3.9 seconds. ***
      the estimated parameters are [50.385 50.616 1.378 10.404 0.500 ].
      for model 2 of 2, the seed is [50.385 50.616 1.378 10.404 0.500 ].
      the estimated parameters are [51.127 75.184 0.687 64.765 0.500 ].
      for model 2 of 2, the seed is [51.127 75.184 0.687 64.765 0.500 ].
      the estimated parameters are [50.548 50.876 1.262 10.909 0.479 ].
    seed 2 was best. final estimated parameters are [50.548 50.876 1.262 10.909 0.479 ].
    trainperformance is 9.28. testperformance is NaN.
  aggregatedtestperformance is NaN.
*** fitnonlinearmodel: voxel 10 (10 of 10) took 3.8 seconds. ***
      the estimated parameters are [54.746 63.766 1.316 53.160 0.500 ].
      for model 2 of 2, the seed is [54.746 63.766 1.316 53.160 0.500 ].
      the estimated parameters are [51.065 53.092 1.592 9.713 0.500 ].
      for model 2 of 2, the seed is [51.065 53.092 1.592 9.713 0.500 ].
      the estimated parameters are [49.660 56.148 2.096 12.292 0.500 ].
      for model 2 of 2, the seed is [49.660 56.148 2.096 12.292 0.500 ].
      the estimated parameters are [52.559 52.818 1.030 23.558 0.857 ].
    seed 1 was best. final estimated parameters are [58.142 79.149 8.758 17.497 0.038 ].
    trainperformance is 8.41. testperformance is NaN.
  aggregatedtestperformance is NaN.
*** fitnonlinearmodel: voxel 7 (7 of 10) took 5.2 seconds. ***
      the estimated parameters are [48.512 57.166 2.159 12.331 0.410 ].
    seed 1 was best. final estimated parameters are [50.499 58.391 11.268 15.107 0.500 ].
    trainperformance is 27.09. testperformance is NaN.
  aggregatedtestperformance is NaN.
*** fitnonlinearmodel: voxel 6 (6 of 10) took 5.4 seconds. ***
      the estimated parameters are [52.331 74.014 0.864 80.685 0.089 ].
    seed 1 was best. final estimated parameters are [52.922 75.000 5.726 80.878 0.428 ].
    trainperformance is 67.46. testperformance is NaN.
  aggregatedtestperformance is NaN.
*** fitnonlinearmodel: voxel 1 (1 of 10) took 7.5 seconds. ***
      the estimated parameters are [18.386 81.949 3.597 65.186 0.500 ].
      for model 2 of 2, the seed is [18.386 81.949 3.597 65.186 0.500 ].
      the estimated parameters are [18.386 81.949 3.597 65.186 0.500 ].
    seed 1 was best. final estimated parameters are [19.481 83.083 4.359 69.333 0.381 ].
    trainperformance is 65.94. testperformance is NaN.
  aggregatedtestperformance is NaN.
*** fitnonlinearmodel: voxel 2 (2 of 10) took 7.2 seconds. ***
      the estimated parameters are [44.758 83.699 9.897 46.849 0.055 ].
    trying seed 2 of 2.
      for model 1 of 2, the seed is [50.500 50.500 1.768 10.000 0.500 ].
      the estimated parameters are [54.663 65.405 1.537 53.663 0.057 ].
    seed 2 was best. final estimated parameters are [54.663 65.405 1.537 53.663 0.057 ].
    trainperformance is 65.65. testperformance is NaN.
  aggregatedtestperformance is NaN.
*** fitnonlinearmodel: voxel 4 (4 of 10) took 7.9 seconds. ***
      the estimated parameters are [41.826 61.618 2.302 11.727 0.005 ].
    seed 1 was best. final estimated parameters are [49.374 64.243 12.199 16.348 0.163 ].
    trainperformance is 25.49. testperformance is NaN.
  aggregatedtestperformance is NaN.
*** fitnonlinearmodel: voxel 5 (5 of 10) took 7.8 seconds. ***
      the estimated parameters are [37.078 66.877 2.172 33.877 0.500 ].
      for model 2 of 2, the seed is [37.078 66.877 2.172 33.877 0.500 ].
      the estimated parameters are [38.909 76.263 2.231 40.091 0.005 ].
    seed 1 was best. final estimated parameters are [44.758 83.699 9.897 46.849 0.055 ].
    trainperformance is 47.80. testperformance is NaN.
  aggregatedtestperformance is NaN.
*** fitnonlinearmodel: voxel 8 (8 of 10) took 9.3 seconds. ***
*** fitnonlinearmodel: ended at 16-Jun-2014 23:52:19 (0.2 minutes). ***
saving results to /tmp/tp50ad011a_57c3_48d8_87a6_6d6e177fc0c3.mat (just in case).
*** analyzePRF: ended at 16-Jun-2014 23:52:19 (0.2 minutes). ***
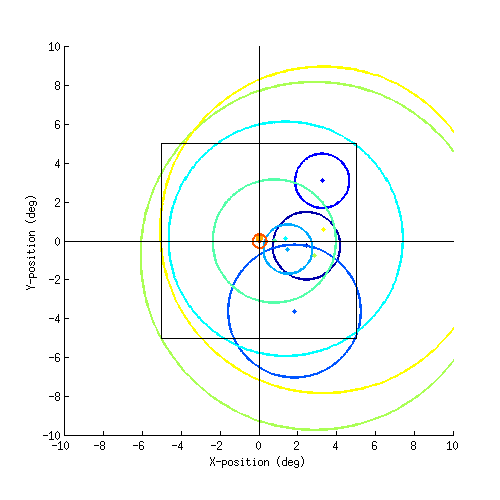
Inspect the results
cfactor = 10/100;
figure; hold on;
set(gcf,'Units','points','Position',[100 100 400 400]);
cmap = jet(size(results.ang,1));
for p=1:size(results.ang,1)
xpos = results.ecc(p) * cos(results.ang(p)/180*pi) * cfactor;
ypos = results.ecc(p) * sin(results.ang(p)/180*pi) * cfactor;
ang = results.ang(p)/180*pi;
sd = results.rfsize(p) * cfactor;
h = drawellipse(xpos,ypos,ang,2*sd,2*sd);
set(h,'Color',cmap(p,:),'LineWidth',2);
set(scatter(xpos,ypos,'r.'),'CData',cmap(p,:));
end
drawrectangle(0,0,10,10,'k-');
axis([-10 10 -10 10]);
straightline(0,'h','k-');
straightline(0,'v','k-');
axis square;
set(gca,'XTick',-10:2:10,'YTick',-10:2:10);
xlabel('X-position (deg)');
ylabel('Y-position (deg)');