Example script showing how to simulate responses of the SOC model
Contents
Add code to the MATLAB path
addpath(genpath(fullfile(pwd,'code')));
Load some stimuli
load('stimuli.mat','images');
stimulus = images(69+[16 70]);
stimulus = cellfun(@(x) x(:,:,1),stimulus,'UniformOutput',0);
stimulus = cat(3,stimulus{:});
Compute the response of the SOC model
cache = [];
[response,cache] = socmodel(stimulus,150,[0 254 127],1.2,{37.5 -1 1 8 2 .01 2 0}, ...
1,.5,1.5,1/1.5,.12,.99,cache);
grid is 90 x 90, gbrsize is 14 (sd is 2.2486875016), indices is [1 3 5 7 9 11 13 15 17 19 21 23 25 27 29 31 33 35 37 39 41 43 45 47 49 51 53 55 57 59 61 63 65 67 69 71 73 75 77 79 81 83 85 87 89 91 93 95 97 99 101 103 105 107 109 111 113 115 117 119 121 123 125 127 129 131 133 135 137 139 141 143 145 147 149 151 153 155 157 159 161 163 165 167 169 171 173 175 177 179]
grid is 90 x 90, gausize is 9, indices is [1 2 3 4 5 6 7 8 9 10 11 12 13 14 15 16 17 18 19 20 21 22 23 24 25 26 27 28 29 30 31 32 33 34 35 36 37 38 39 40 41 42 43 44 45 46 47 48 49 50 51 52 53 54 55 56 57 58 59 60 61 62 63 64 65 66 67 68 69 70 71 72 73 74 75 76 77 78 79 80 81 82 83 84 85 86 87 88 89 90]
working....................done.
[response2,cache] = socmodel(stimulus,150,[0 254 127],1.2,{37.5 -1 1 8 2 .01 2 0}, ...
1,.5,1.5,1/1.5,.12, 0,cache);
working....................done.
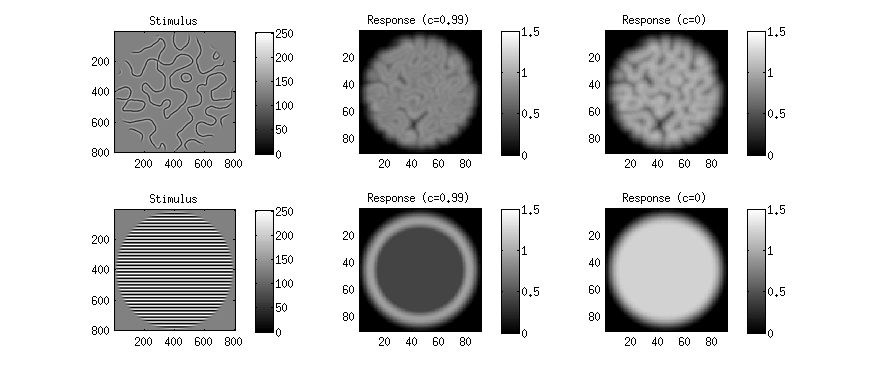
figure; setfigurepos([100 100 700 300]);
for p=1:2
subplot(2,3,(p-1)*3+1);
imagesc(stimulus(:,:,p),[0 254]); axis image tight; colormap(gray); colorbar; title('Stimulus');
subplot(2,3,(p-1)*3+2);
imagesc(response(:,:,p),[0 1.5]); axis image tight; colormap(gray); colorbar; title('Response (c=0.99)');
subplot(2,3,(p-1)*3+3);
imagesc(response2(:,:,p),[0 1.5]); axis image tight; colormap(gray); colorbar; title('Response (c=0)');
end